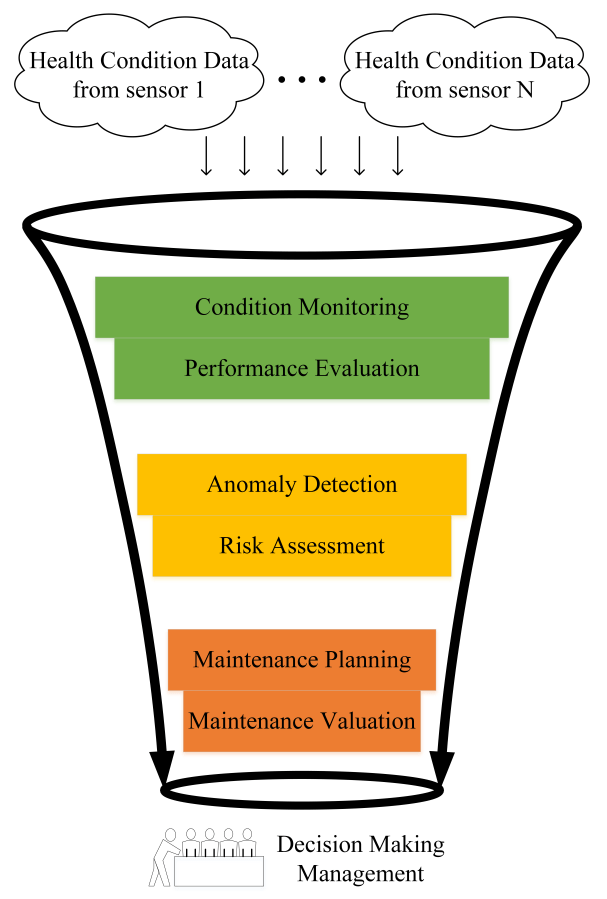
Figure 1. Condition monitoring chain
Introduction:
In stage one, it starts by analyzing the collected data at the component level and developing methodologies to extract knowledge from the collected data. It proposes methodologies to link the data to maintenance and performance of the component. Next, in stage two, it tests and establishes a link between the component and system through the collected data and methodologies. Then, in stage three, it certifies this link by further investigating the system operation and adding additional points such as conflicting objectives of agents in an electricity market as well as uncertainty in demand and wind. Moreover, it also proposes new models to evaluate profitability in offshore wind farms and microgrids when there is no incentive demonstrating strategic operation schemes.
Stage One:
In this regard, at first stage, four frameworks are developed to provide a path in translating the collected data from components into operation improvement. All the four frameworks have three steps in common. They perform an initial data analysis (DA), create a normal behavior model (NBM) and derive a deviation signal (DS) to evaluate behavior deviation from normal operation. Next, depending on the specific objective, each framework follows a different path.

Figure 2. Data based frameworks
The first framework is a root-cause-analysis (RCA) where it uses the collected data in a component to identify the faulty sub-assembly. After the DS step, it develops an anomaly detection (AD) through statistical techniques such as principal component analysis (PCA) [1].
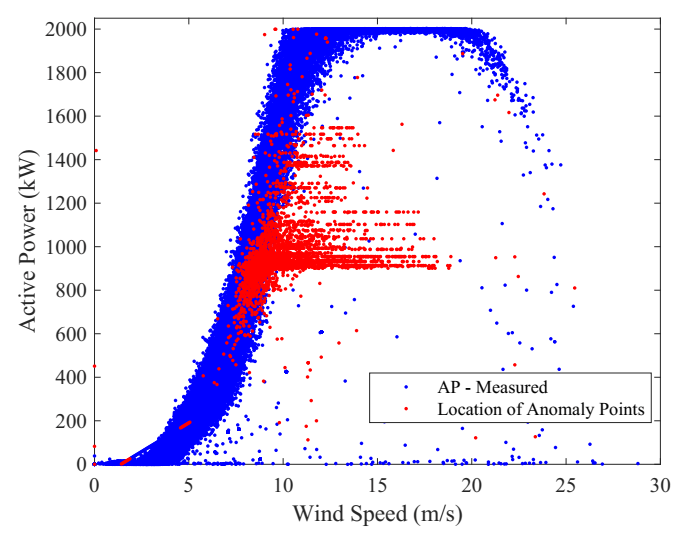
Figure 3. Anomaly detection capability in RCA methodology
The second framework is a mid-term operation analysis (MOA). Through a behavior pattern recognition (BPR) step, MOA detects the different patterns that the component faced during the operation. Then, it classifies these patterns into different classes based on the physical interpretation of the pattern. Such a tool also provides a benchmark for comparing performance of different components. Moreover, employing the Markov chain technique allows analysis of the performance of the component through a probabilistic manner that addresses uncertainties as well [2].
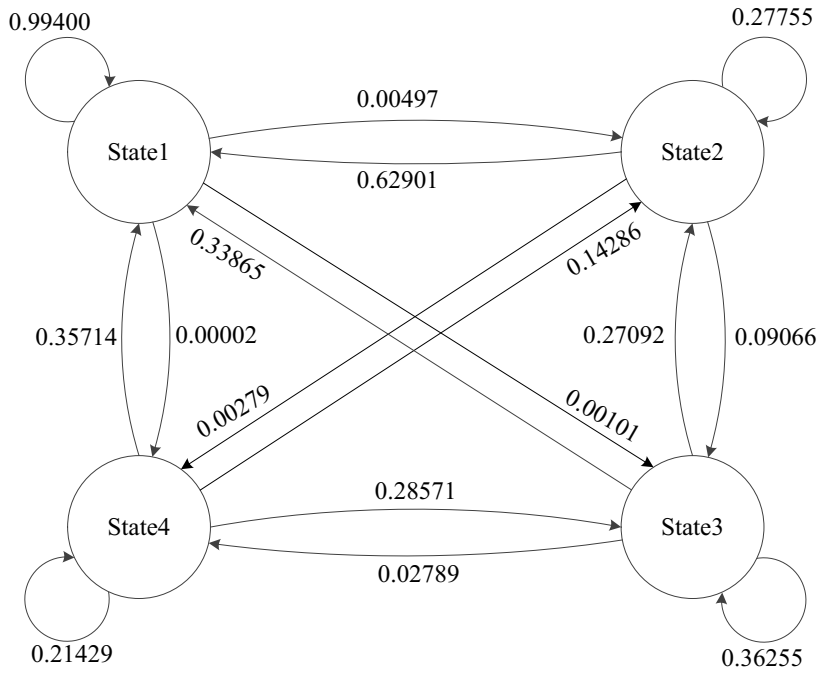
Figure 4. Sample Markov chain model for a component derived from data
The third framework is a maintenance analysis (MNA) that uses proportional hazards model (PHM) technique in combination with little data about the maintenance to assess the efficiency of the deployed maintenance actions during its past operation. Hence, it provides an assessment on whether the current maintenance strategies are efficient or new ones should be used [3].
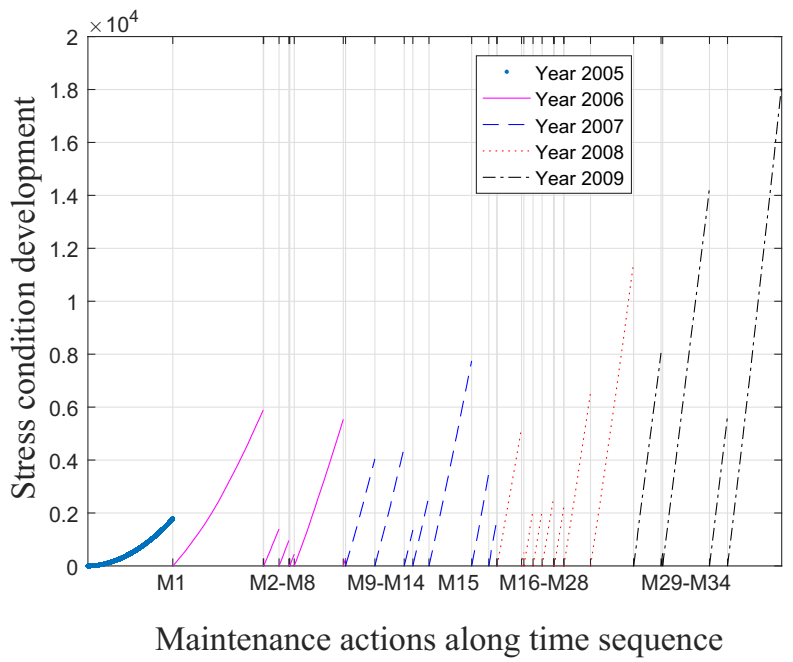
Figure 5. Assessment of the past maintenance actions
The fourth framework is a performance analysis (PRA) that can be used for real-time performance monitoring as in Figure 6, or a tool to compare the performance of several components as in Figure 7. One important feature of this performance indicator tool is its parametric form that is extracted from a black-box model [4].
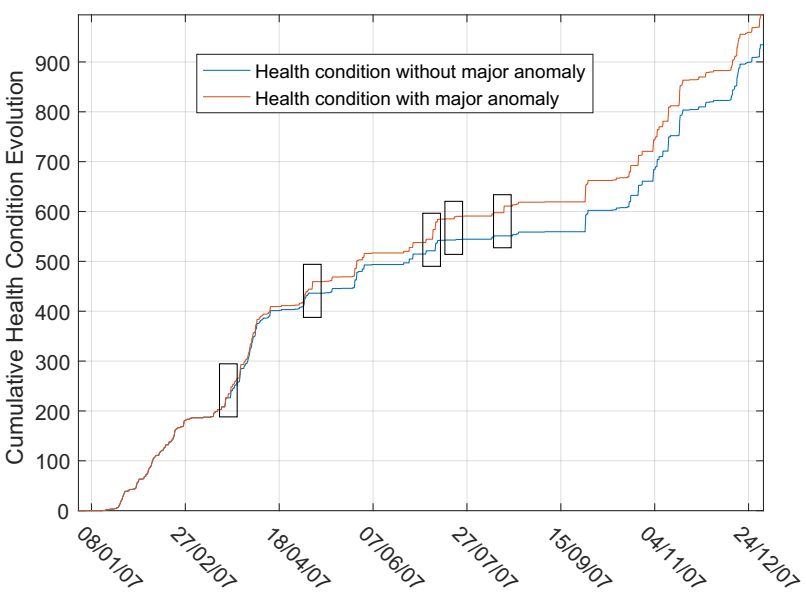
Figure 6. Real-time performance indicator in presence of anomalies
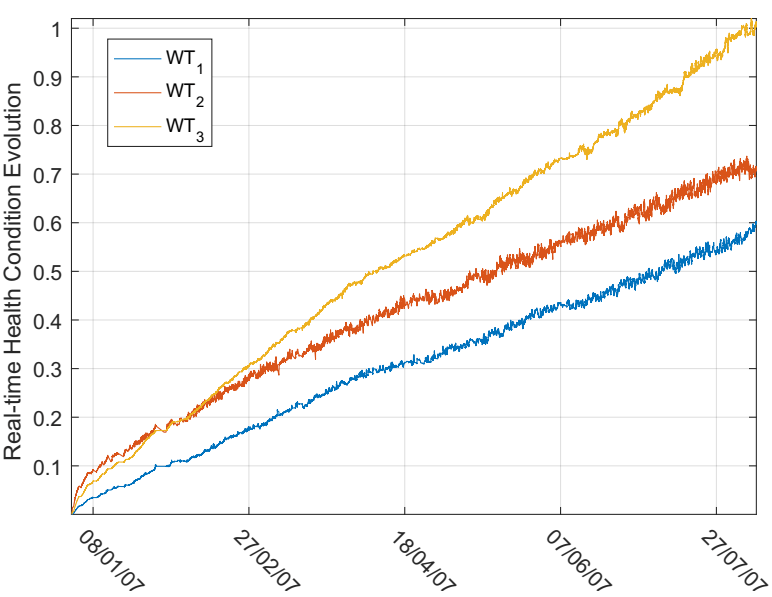
Figure 7. Real-time performance indicator as a comparative tool
Stage Two:
To link the component level data to the system level operation, the hourly network constraint unit commitment (HNCUC) problem in power system context is selected. The HNCUC problem is supplemented with the component level models and performance indicators developed in the stage one. This integration provides a new perspective that assists in reducing risk in operation since the condition data are embedded in the operation. The results show direct improvement in operation of the power system by increasing the security of the system [5].
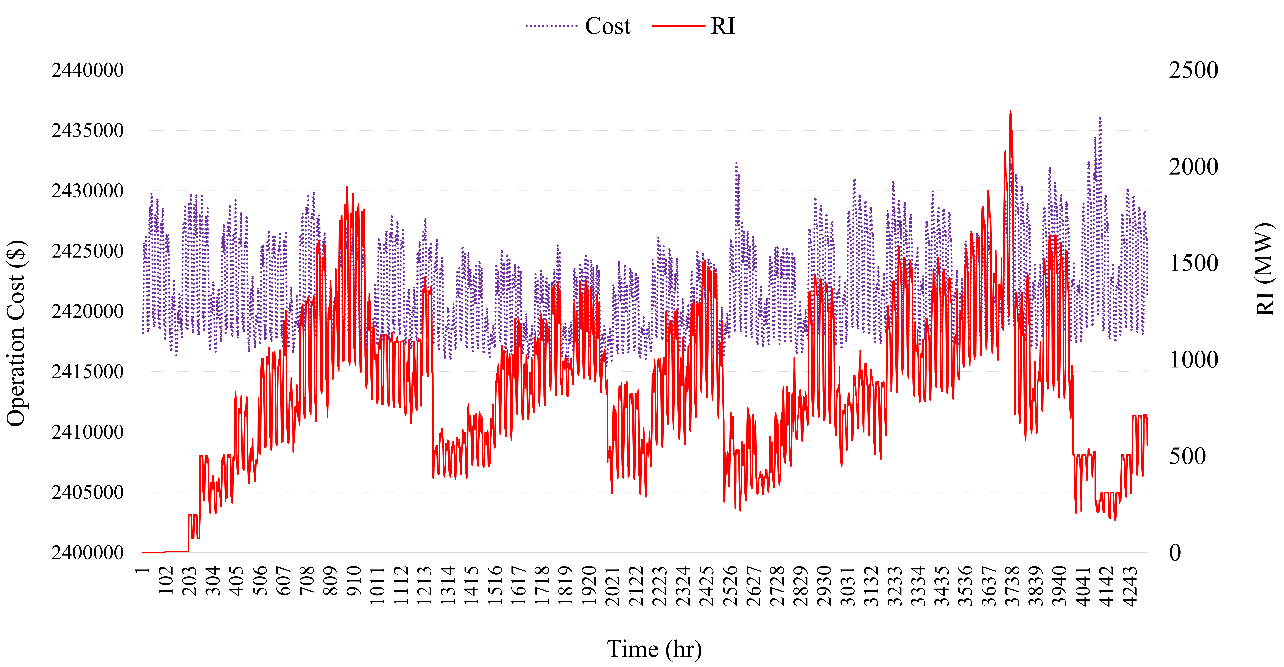
Figure 8. Cost-risk operation in modified HNCUC problem
Stage Three:
In stage three, the paper dives into detailed analysis of preventive maintenance scheduling in power system generation through three distinct studies. It addresses recent challenges such as integration of renewable energy sources with their intermittent nature, relation between maintenance and electricity market in both regulated and deregulated structures, offshore wind farm and microgrid maintenance and operation in an era without incentives for renewable sources. In all three studies the models compare centralize and decentralize maintenance and operation from profitability and cost perspectives.
The first study investigates how a decentralized operated power system can reach the equilibrium while maintaining reliability and economic constraints imposed by different market participants. It evaluates integration of a new renewable source as a single player and as a combined operation with other players in the system. It provides a strategic portfolio assessment of the system in a deregulated power system. In addition, it considers stochasticity in demand and wind renewable source and raises the challenges in advancing this area [6].
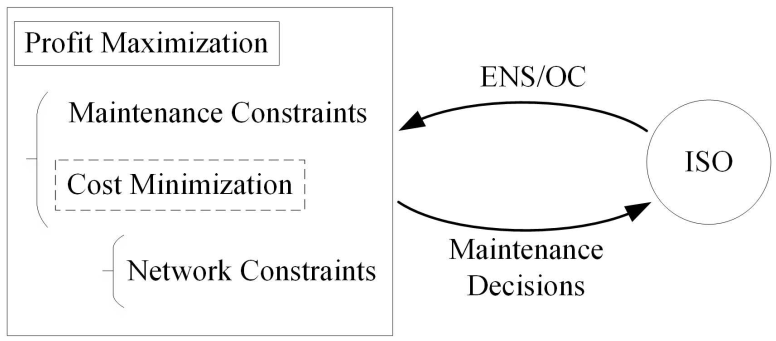
Figure 9. Maintenance and operation criterion in deregulated structure
The second study considers operation and maintenance scheduling problem in an offshore wind farm when it is participating in the electricity market. It studies the potential profitability of the farm when it receives no incentive. It considers different vessels for maintaining condition of the wind turbines in the farm at a stable level while addressing uncertainty in wind, wave and wind turbines. Moreover, while 24/7 working shift did not provide much improvement for the profit, neglecting wake effect displayed great overestimation in profit [7].
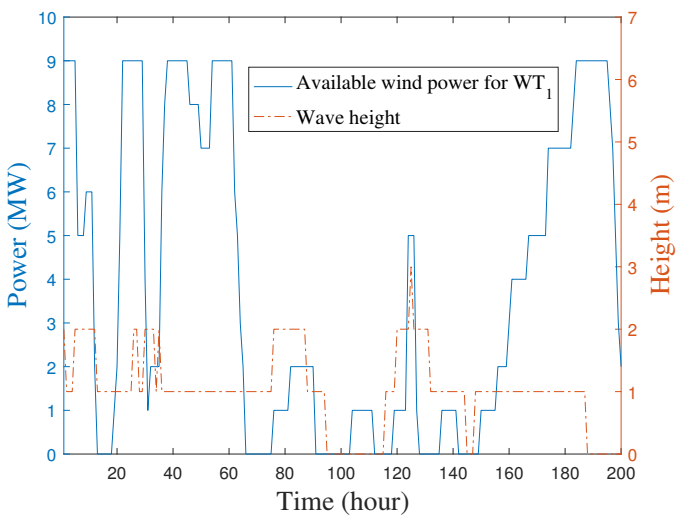
Figure 10. Forecasted available wind and wave height
The third study analyzes maintenance and operation in a microgrid that operates in an islanded mode. It receives demand, wind and solar forecasts and delivers optimum results for charge and discharge of batteries, maintenance decisions and power dispatch values. Due to consideration of a life-cycle cost factor for the battery, the houses will try to reduce the battery utilization unless it becomes more profitable in the whole time horizon. Direct integration of condition data, which are extracted in the stage one, is also studied and display great potential in profitability and risk reduction. Similar to the previous studies in this stage, this operation has been compared in centralized and decentralized frameworks with the electricity market [8].
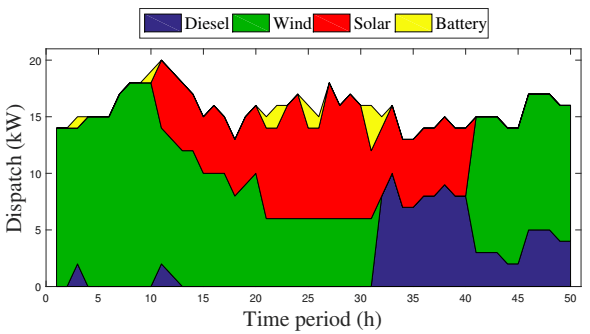
Figure 11. Production shares
General Conclusion:
This paper provides a link between operation data recorded at the sub-assembly level in a component and maintenance scheduling in the system. The models were tested in electric power system context where they can be applied to other industrial environment as well. It provides data-driven frameworks to improve operation of the assets, links the component level developed models with system level operation to reduce risk, and connects these frameworks to centralized and decentralized operation by studying specific cases of an offshore wind farm and an islanded microgrid to demonstrate profitability potential of these agents.
Specific Conclusion:
– With enough data, based on experience, statistical techniques require human expert knowledge and inference capability in order to extract a meaningful result of failure analysis on a component.
– Due to the stochastic nature of the operation of the assets, probabilistic methods provide sound mid-term information on performance of the assets.
– Statistical models can be a tool to compare assets under similar operating conditions and evaluate efficiency of their performance.
– Even with little maintenance data, it is possible to develop models that can evaluate the past maintenance actions solely through operation data.
– For assets like wind turbines with their nonlinear characteristics, neural networks demonstrate accurate models for real-time operation of the asset.
– Parametric models are greatly required for overall analysis of performance of an asset, to address issues such as scalability and adaptability.
– There is great potential in linking operation data collected from assets in system level decision making to reduce risk.
– Renewable sources can expect profitability with strategic operation without needing incentives even for maintenance.
– Wake effect should be considered in revenue analysis of offshore wind farms to avoid overestimation of profit.
– Battery storage systems should consider their life-cycle cost before participating in the market.
References
[1] P. Mazidi, L. Bertling-Tjernberg and M. A. Sanz-Bobi, “Performance analysis and anomaly detection in wind turbines based on neural networks and principal component analysis,” in 12th Workshop on Industrial Systems and Energy Technologies (JOSITE17), Madrid, Spain, 2017
[2] P. Mazidi, L. Bertling-Tjernberg and M. A. Sanz-Bobi, “A performance and maintenance evaluation framework for wind turbines,” in International Conference on Probabilistic Methods Applied to Power Systems (PMAPS), Beijing, China, 2016.
[3] P. Mazidi, L. Bertling-Tjernberg and M. A. Sanz-bobi, “Wind turbine prognostics and maintenance management based on a hybrid approach of neural prognostics and maintenance management based on a hybrid approach of neural,” Journal of Risk and Reliability, vol. 231, no. 2, 2017.
[4] P. Mazidi, D. Mian, L. Bertling-Tjernberg and M. A. Sanz-Bobi, “A health condition model for wind turbine monitoring through neural networks and proportional hazard models,” Journal of Risk and Reliability, vol. 231, no. 5, 2017.
[5] P. Mazidi, M. A. Sanz-Bobi, E. Shayesteh and P. Hilber, “Impact of health indicators on maintenance management and operation of power systems,” Journal of Risk and Reliability, vol. 231, no. 6, 2017.
[6] P. Mazidi, Y. Tohidi, A. Ramos and M. A. Sanz-Bobi, “Profit maximization generation maintenance scheduling through bi-level programming,” European Journal of Operational Research, vol. 264, no. 3, pp. 1045 – 1057, 2018.
[7] P. Mazidi, Y. Tohidi and M. A. Sanz-Bobi, “Strategic maintenance scheduling of an offshore wind farm in a deregulated power system,” Energies, vol. 10, no. 3, 2017.
[8] P. Mazidi and M. A. Sanz-Bobi, “Strategic maintenance scheduling in an islanded microgrid with distributed energy resources,” Electric Power Systems Research, vol. 148, pp. 171 – 182, 2017.